KMeans
For the case study, we try to discover meaningful customer groups for market segmentation.
Import Python libraries
# import libraries

import pandas as pd
from sklearn.cluster import KMeans

import matplotlib.pyplot as plt
import seaborn as sns
sns.set_style("whitegrid")
Load and verify data
Next, we load and verify the data. Although there are four columns, we only use Income and Score for clustering. Income is the customer’s personal income. Score is an indexed score of how much the customer spends at the mall.
df = pd.read_csv("data/mallcustomers.csv")
df.head()
| Gender | Age | Income | Score | |
|---|---|---|---|---|
| 0 | Male | 19 | 15 | 39 |
| 1 | Male | 21 | 15 | 81 |
| 2 | Female | 20 | 16 | 6 |
| 3 | Female | 23 | 16 | 77 |
| 4 | Female | 31 | 17 | 40 |
Run K-Means
Next, we run \(K\)-Means with \(k\) (number of clusters) set at \(k=5\).
X = df[['Score','Income']]
km = KMeans(n_clusters=5).fit(X)
results = km.predict(X)
clusters = pd.DataFrame(results,columns=['cluster'])
df_c = X.join(clusters, how='outer')
df_c.head()
| Score | Income | cluster | |
|---|---|---|---|
| 0 | 39 | 15 | 4 |
| 1 | 81 | 15 | 3 |
| 2 | 6 | 16 | 4 |
| 3 | 77 | 16 | 3 |
| 4 | 40 | 17 | 4 |
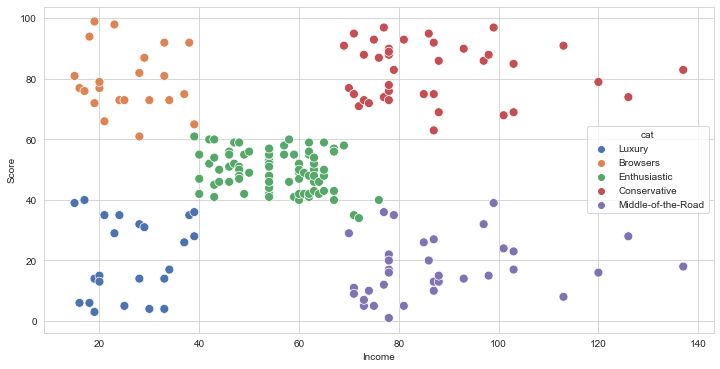
category = {0:'Enthusiastic', 1:'Conservative',
            2:'Middle-of-the-Road', 3:'Browsers',4:'Luxury'}
df_c['cat'] = df_c['cluster']
df_c = df_c.replace({'cat':category})
Display Results
plt.figure(figsize=(12,6))
sns.scatterplot(x="Income",y="Score",data=df_c,hue="cat",
                palette="deep", s=80)
<AxesSubplot:xlabel='Income', ylabel='Score'>